
When a green starts to suffer, the human eye usually arrives late: the colour change is only obvious once the damage is done. NDVI for turf promises to get ahead of that moment, because it measures plant vigour from the light it reflects, even when no symptom is yet visible from the buggy.
In this article we explain what NDVI for turf is, five specific uses on a golf course and the precautions needed to read the maps correctly. You will see that it is a valuable support tool, not an oracle, and that its value depends on combining it with on-the-ground observation and with a good record of what is done afterwards.
What NDVI is and what it really measures
NDVI, or Normalised Difference Vegetation Index, compares the red light absorbed by chlorophyll with the near-infrared light reflected by the leaf structure. A healthy, dense plant absorbs a lot of red and reflects a lot of infrared, giving high values; a stressed or sparse plant gives low values.
It is important to understand its limits:
- It measures relative vigour, not cause: it indicates that something is happening, but not why.
- It depends on the species, the cutting height and the turf density.
- Values change with light, time of day and surface moisture.
That is why NDVI for turf is best interpreted by comparing zones and dates within the same course rather than by looking at a single absolute value.
Use 1: NDVI for turf to detect water stress in time
The first use, and the most widespread, is to get ahead of localised drought. When turf loses vigour through lack of water, the index drops before the colour changes noticeably. A map compared week by week lets you detect patches with a downward trend.
With that information the team can go straight to the flagged spots, check whether the problem is irrigation coverage, infiltration or soil, and correct it with hand watering or sprinkler adjustments. It is an aid for prioritising inspection, not for replacing the course walk: the map says where to look, and the greenkeeper decides what to do.
Use 2: Locate weak areas and variability across the course
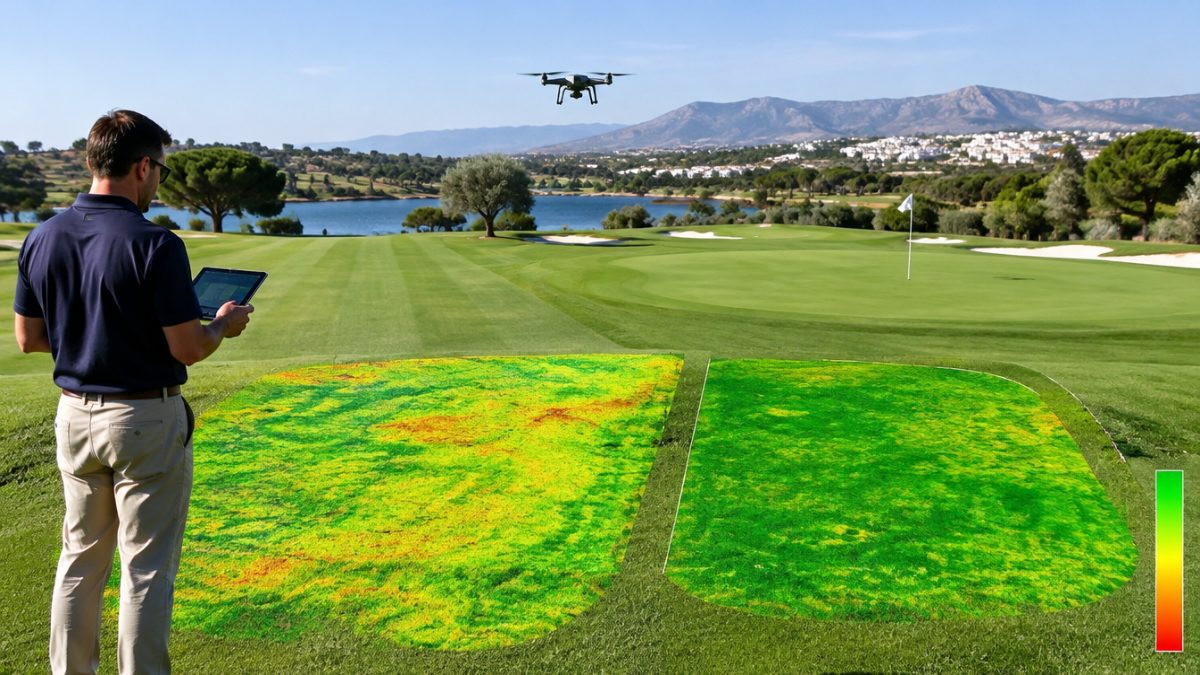
An NDVI map of turf reveals patterns that are hard to see from the ground. A fairway with weaker stripes may indicate faulty irrigation overlap; a green with a depressed side, a problem of shade, compaction or drainage.
- Compare the vigour distribution with the irrigation system layout.
- Cross-reference weak areas with the history of operations and applications.
- Verify on the ground before undertaking costly changes.
The value lies in turning impressions into evidence: NDVI for turf provides a very convincing visual argument to management when an investment in irrigation or drainage is requested.
Use 3: Evaluate the effect of an operation or treatment
The third use of NDVI for turf is monitoring. After aeration, overseeding or a nutrient application, comparing vigour before and after gives an objective idea of the turf’s response. It is useful for deciding whether a practice is working or needs correcting.
Caution is needed: many factors act at once, such as weather, irrigation or play. To draw reliable conclusions, compare with a reference area that did not receive the operation, note the dates precisely and do not attribute to the treatment what may be due to the weather. With discipline, this data builds knowledge specific to your course. A typical case: after aeration on the fairways on one side of the course, the NDVI map shows faster recovery than in the untreated area, and that supports extending the practice to the rest on the basis of evidence and not just intuition.
Use 4: Plan sampling and inspections
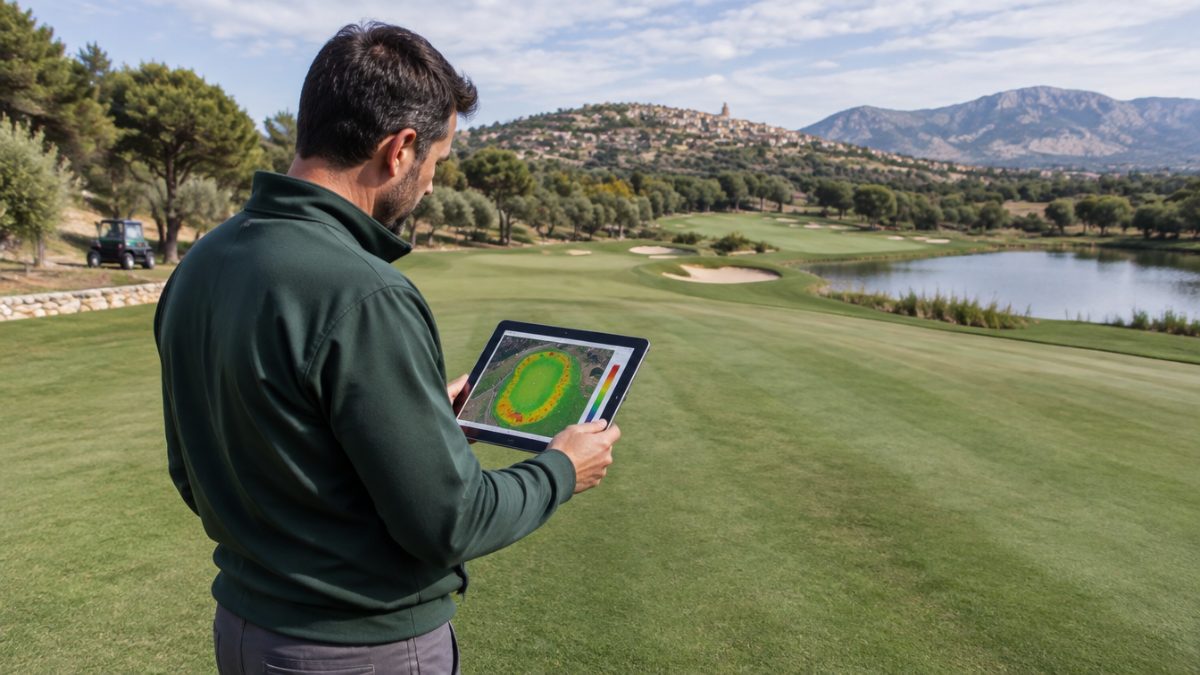
Another practical use of NDVI for turf is to direct sampling better. Instead of taking soil samples, measuring moisture or digging test pits at arbitrary points, the map lets you choose points that are representative of the strong, average and weak zones.
- Take soil samples where vigour differs.
- Measure compaction or moisture in the flagged patches.
- Keep a photographic record of each point checked.
This saves time, reduces the number of samples needed and yields more solid conclusions about what is happening in each zone.
Use 5: Communicate better with management and members
A colour map is understood at a glance. Used with judgement, NDVI for turf helps explain why an area needs attention, what has been done and what result it had, without technical jargon. It is a useful resource in presentations to the greens committee.
That said, do not promise more than the tool delivers. Presenting it as a complementary indicator, alongside the team’s observations and the history of operations, builds trust. And remember that a pretty map with no follow-up action does not improve the course: what counts is what is done afterwards with the information.
Precautions: how not to go wrong with NDVI for turf
To make NDVI for turf reliable, a few basic criteria help:
- Capture images under comparable light conditions and at similar times of day.
- Compare zones with the same turf type and cutting height.
- Take into account shadows, surface moisture and bare substrate, which can distort the index.
- Always cross-check with visual inspection and the team’s judgement.
Finally, start small. Choose one or two pilot areas, define what you want to learn and assess whether the effort pays off before expanding. The tool is only one part of the process; the value appears when it is integrated with the record of operations and with day-to-day decision-making.
Further reading: FAO. The FAO (Food and Agriculture Organization of the United Nations) publishes technical information on remote sensing and vegetation monitoring, the basis of indices such as NDVI.
Frequently asked questions
What is NDVI for turf and what is it for?
NDVI for turf is an index that estimates vegetation vigour from the light it reflects. It is used to detect stress, locate weak areas and compare the course's progress between dates. It does not indicate the cause of the problem, so it must always be cross-checked with on-the-ground inspection.
Is NDVI useful on greens with a very low cutting height?
It can be, but with more limitations. At very low heights there is less leaf mass and the soil has more influence on the signal. It works better for comparing areas within the same surface and over time than for extracting absolute values. Start with trials and compare with what the team sees.
Does NDVI replace the greenkeeper's inspection?
No. It is a support tool that indicates where to look, but it does not explain what is happening. Interpretation, decision and corrective action still depend on the judgement of the greenkeeper, who knows the course's history, soil and climate. The best results come from combining objective data with experience.
Keep reading
- Drones on golf courses: valuable applications Drones on golf courses: 6 valuable applications
- Artificial intelligence in greenkeeping: real uses Artificial intelligence in greenkeeping: 7 real uses
- Soil moisture sensors: uses in golf Soil Moisture Sensors: 6 Key Uses in Golf